
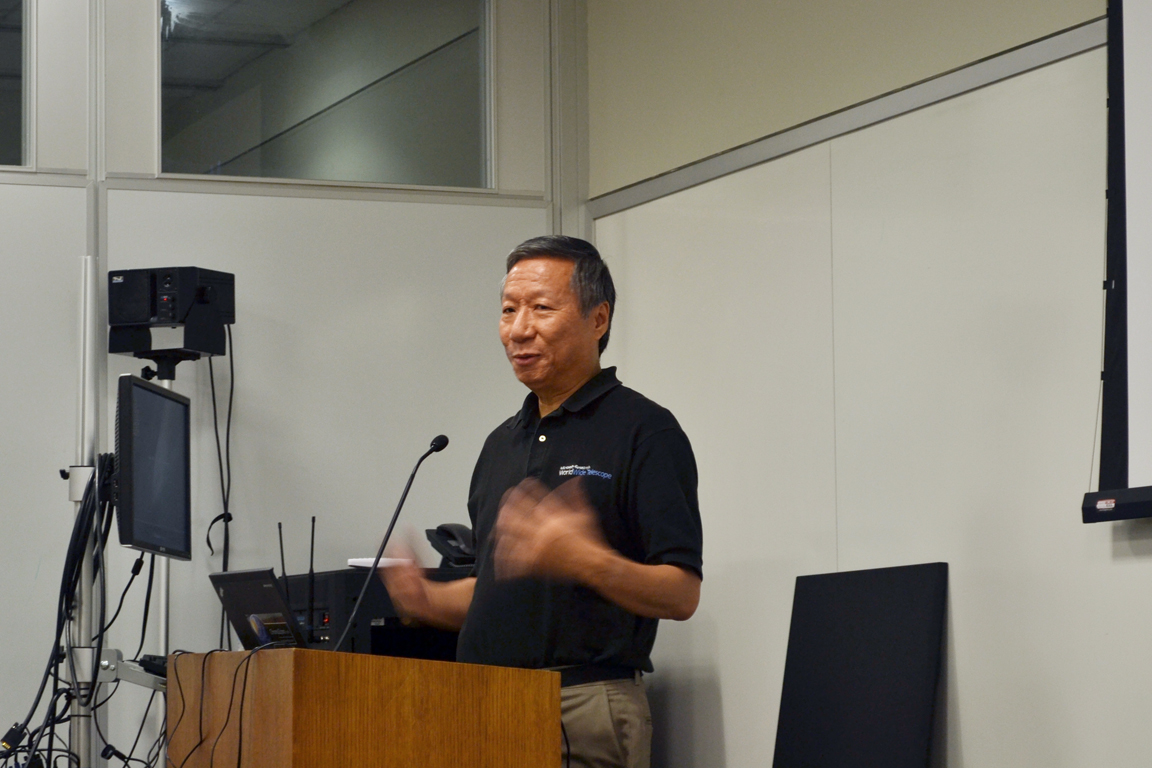
CUNY’s Futures Initiative hit the ground running on October 3rd with its first official event—an awe-inspiring digital storytelling odyssey that took the audience from the early days of interactive software and CD-ROMs to multi-dimensional spatiotemporal explorations of deep space. Curtis Wong, principal researcher at Microsoft Research, shared with us an insider look at many of the stunning projects he’s been involved with over his long career in educational media development that are built on a common framework for effective digital storytelling. This model for learning aims to capture interest and engagement, then helps build mental models through contextual exploration and simulation, and finally validates the models with supporting reference information and data.
Curtis confided that he has always been personally captivated by the universe and has consistently wanted to visualize and comprehend it. As a child, Curtis found inspiration in coloring books depicting the planets of the solar system. By the time he reached high school, he was working on detailed star diagrams of the night sky. Still later in life, he become interested in the power of maps as a blend of art and science that attempt to visualize and codify our best current knowledge of the real world.
Public understanding of maps was one of the drivers that motivated Curtis to build the framework for experiential digital learning platforms of everything from art museums to the multi-dimensional representation of earthquakes across time and the three dimensions of space. In 1993, he was struck by research that showed only 8 percent of students could identify Madagascar on a world map, but 65 percent of kids could identify Yoshi’s Island on a map of Super Mario World. At the time, digital technology was capturing kids’ interests in games, but the same virtual mapping was not having application to the real world. Curtis wanted to create maps that were more useful for real world applications and that told meaningful stories.
Curtis’ interest in storytelling through digital media began when he was a producer for the Criterion Collection from 1989 – 1993. He said his time in that role taught him important lessons about the role of storytelling in film. Next, he joined a start-up company that was working on CD-ROM development and this is where he really started to focus on how to build stories using digital tools.
An Odyssey of Curtis’ Visualization and Storytelling Projects from CD-ROM to Microsoft Research:
A Passion for Art – 1994
In this CD-ROM project, Curtis’ team wanted to give both a spatial sense of the Barnes art collection as well as providing rich detail through storytelling of the art works. Curtis said that it was important to present things in context. By designing the exhibit as a virtual gallery, users could explore the galleries through the floor plan map of the Barnes Foundation. This helped to build virtually a mental map of the real world facility. The bottom layer was represented by archives information that added another level of background and dimensionality to the entire experience users could navigate.
FDR
This CD-ROM project introduced Roosevelt and provided narratives that added context to the historical situation. Users could explore different layers of the narrative — the different houses he lived in, a broader timeline that highlights important speeches, public moments, etc.
End of the CD-ROM Era
By the time CD-ROMs were beginning to decline in popularity, Curtis had developed a good reputation for that kind of material, but he then began to think about how to carry the storytelling experience onto the World Wide Web. One of the first initiatives he was involved in was the creation of ArtMuseum.net. This was a virtual Van Gogh Museum. You could even chat with other viewers in the museum. At individual artworks, you could explore other letters and drawings related to the artist or patron to build a more complete background and understanding for the context of the individual art works.
Commanding Heights – PBS
It was during his time at PBS that Curtis said the future of television is really on the Internet, particularly with the opportunity of interaction and education. Traditional broadcasters felt constrained by time available for programing to tell stories, but by carrying the project online as well, you could expand the amount of storytelling that was possible. For example, discussion on political economy in Germany on the TV program could be coupled with transcripts, atlases, diagrams, and more information online.
The Age of AIDS
Again thinking about storytelling–the Frontline program presented the story–the web components provided dynamic information and data to understand the nature of AIDS on society/economy.
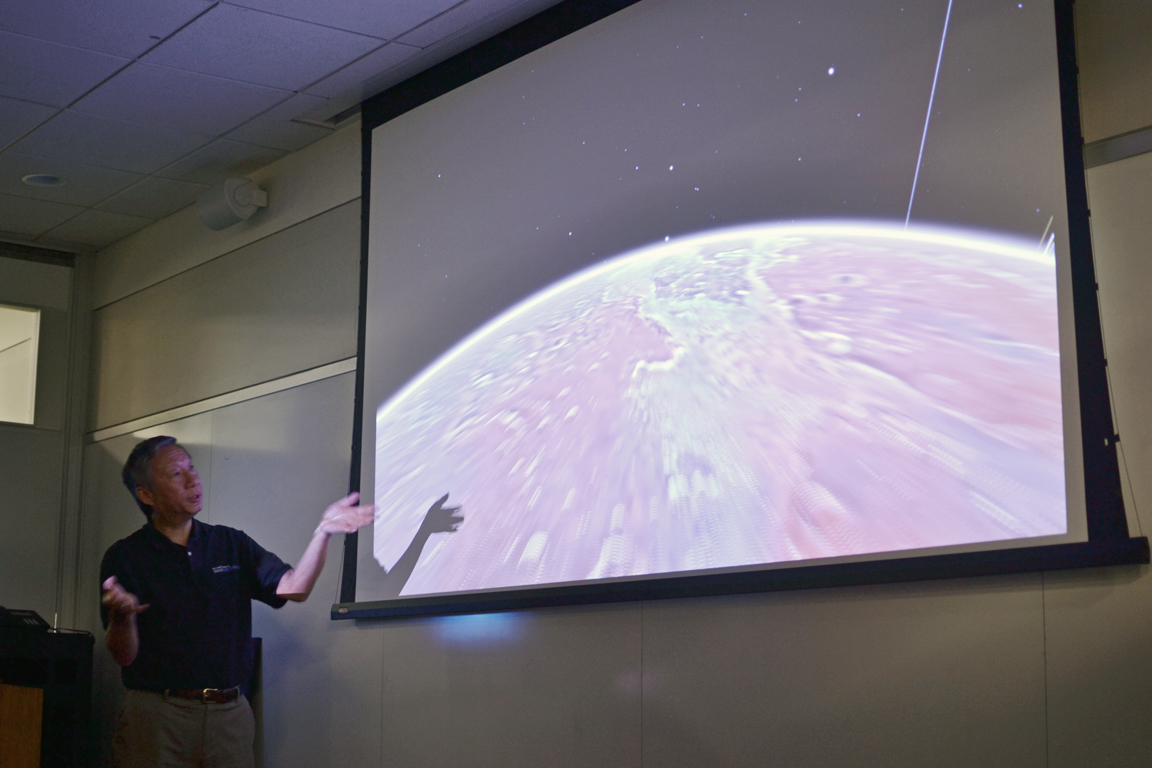
WorldWide Telescope
With the WorldWide Telescope (WWT) project, Curtis began to use visualizations to demonstrate both three dimensional space and temporal reality. Guided tours provide a virtual path through the environment and can be displayed like a movie. The celestial bodies are all displayed accurately in a 3D space. Within this space, information can also be accessed on the color, light waves, etc. from each of the different bodies. Users could create their own stories and tours through the universe to share with others. Curtis said, “Its not just a movie but can be interacted with at any point during the exploration.”
The audience was astounded to hear that the WWT project was developed by a team of only Curtis and two others.
Curtis demonstrated how WWT has been used to help understand the structure of the Milky Way Galaxy and our solar system’s position within that. WWT has also been featured on the children’s television show Fetch. WWT has also been used for localized heritage stories and have constructed tours coupled with local cultural stories. Another cultural exploration involves the WWT framework for interactive exploration of cave artwork. In addition to viewing the cave artwork like a virtual gallery, users could also link to and explore other resources such as articles and other background on the artwork.
Curtis also noted that one of the best things about the construct of the spatiotemporal data in WWT is that it is constantly being updated and added to.
Project TUVA
With Project TUVA, Curtis said they wanted to provide the scientific lectures in video but also wanted to annotate with related content as the content was playing. Students provided questions on content and then research was found to help answer those questions through links and annotations to different information that could be explored to better understand the concept of focus in the lectures. Students could also share notes dynamically. Professors could also add annotations to share what concepts to focus on, etc.
Touch Art Gallery
With the Touch Art Gallery, they wanted to provide tools for small museums to provide touchscreen tours.
Power Map
With the Power Map project for Microsoft Excel they wanted to make data visualization tools over time and space available for more people. They designed the program so that data in Excel spreadsheets could easily be plotted it in space and time if the right spatial and temporal data points were present.
Chronozoom http://research.microsoft.com/en-us/projects/chronozoom/
Chronozoom is another Microsoft Research project Curtis was involved with that is a temporal equivalent to WWT. They wanted to combine everything from beginning of cosmos to today. Currently Chronozoom is in open source HTML5. The project is slated to transition to collaborative ownership and maintenance by a consortium of universities.